GimbalWorks

GimbalWorks

Editor tools for the loop between code and seeing it run

Three tools for the gap between writing code and seeing what it does: live script reload that keeps Play Mode state, memory profiling that names the leak and the field holding it, and AI localization that catches what the translation broke. Verified by running, not by compiling.

Live code reload

RuntimeCode

Edit a method body, save, and the running game picks up the change. No compile pause, no exit from Play Mode, no replaying three waves to reach the moment you were testing.

  • State survives. Score, health and elapsed time carry across every edit.
  • Every patch is logged with its file and how long it took.
  • The strategy is checked, not assumed — at startup it patches one of its own methods and verifies the result really changed.
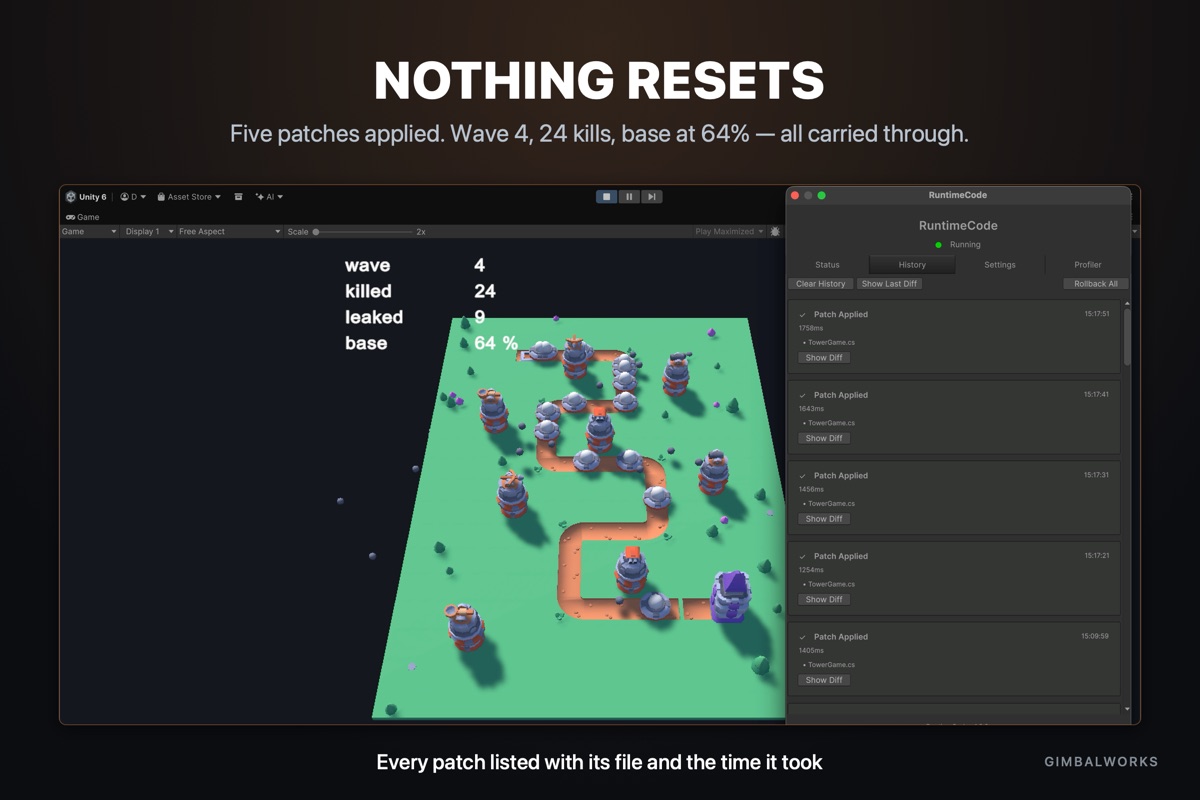
RuntimeCode patching a running tower defence

Memory profiling

Memory Profiler Companion

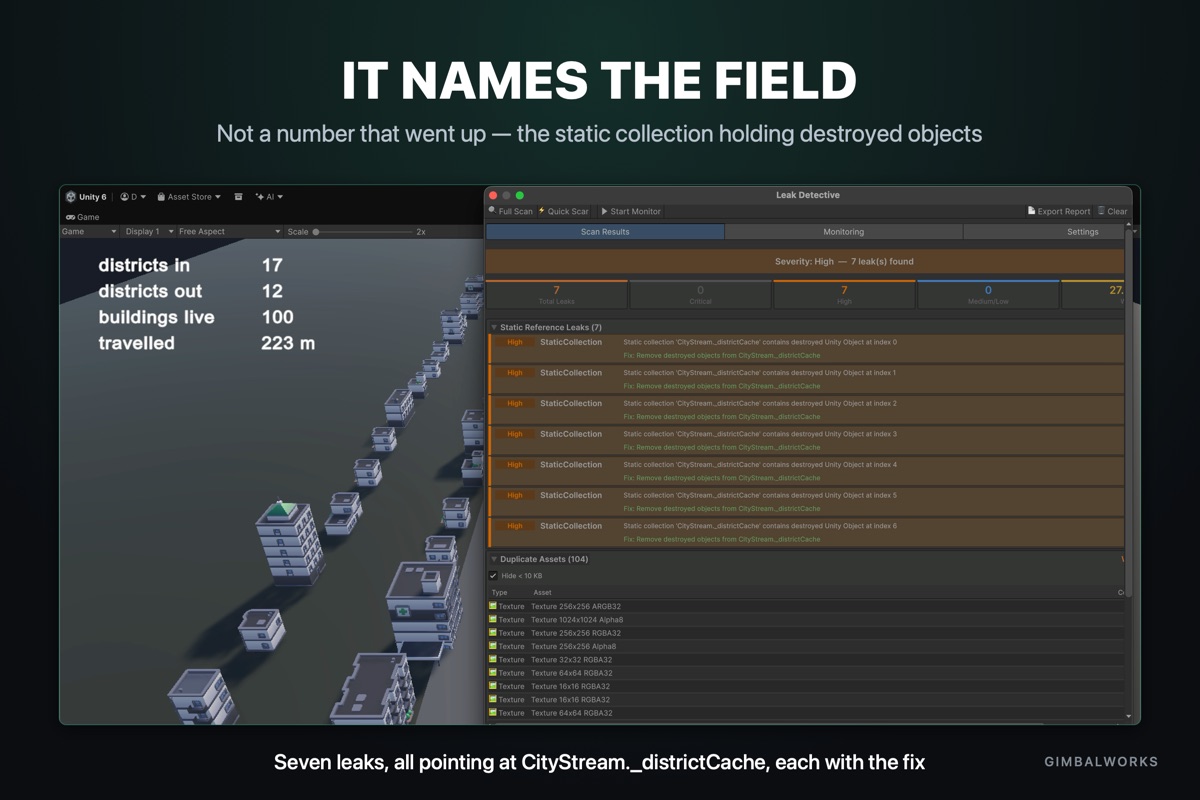
A number that went up tells you nothing. This one names the static collection holding destroyed objects, the field it lives in, and what to do about it.

  • Snapshot and compare — native, managed and graphics against the platform budget you ship on.
  • Largest assets first, with the cost of each and a button that jumps to it.
  • Duplicates caught — the same texture under two names costs twice and looks fine.
Leak Detective naming the leaking field

Localization

AI Localization Pipeline

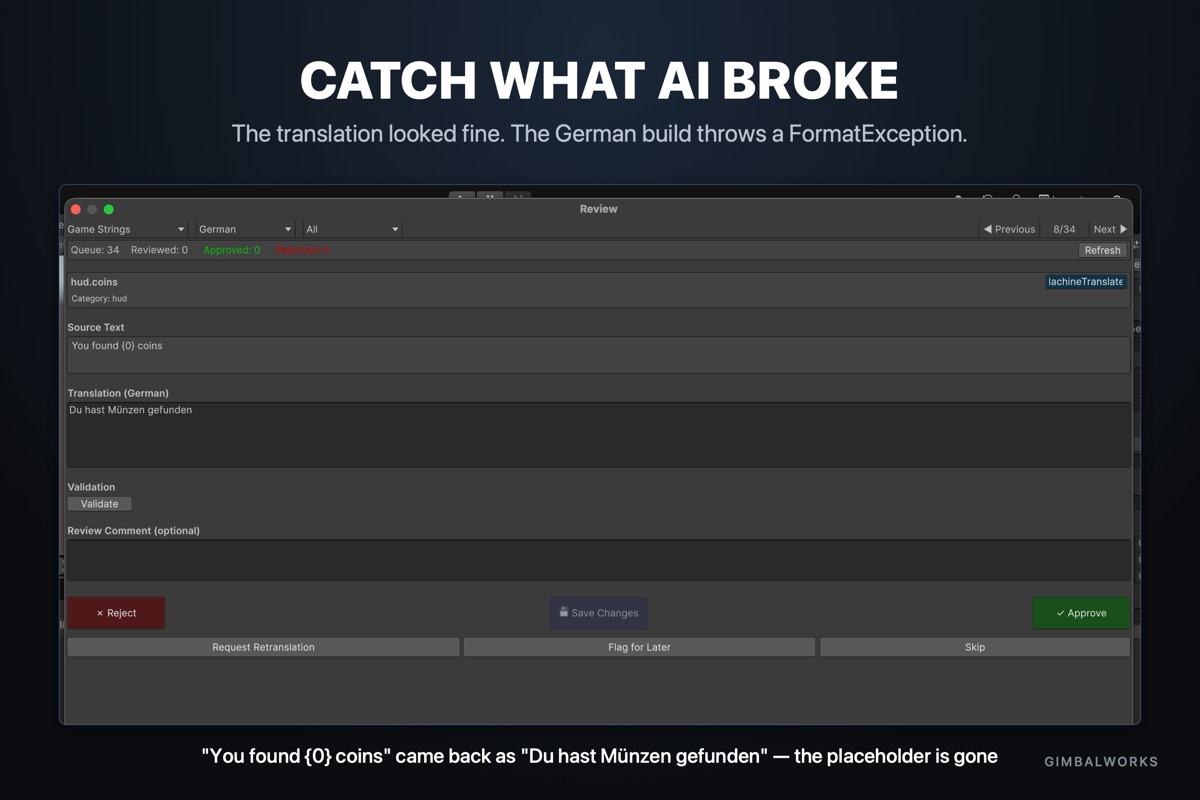
Machine translation is fast and mostly right. The problem is the “mostly”: a translator drops {0} from “You found {0} coins”, and the German build throws a FormatException in front of a player you will never hear from.

  • Translate through the provider you choose — OpenAI, Claude, DeepL, Google. Your keys, your account.
  • Then check what it broke: lost placeholders, terminology drift, text that no longer fits the button.
  • A glossary the translator must honour, plus a review queue for what needs a human.
Review queue finding a lost placeholder

How these are tested

Every release is run against the Unity editor on real data, not checked for compilation. Nine defects in these three packages were found that way and could not have been found any other: memory reported as 196 MB native inside a 162 MB total, a time-until-collection of 3.4×1038 seconds, savings that were calculated and then discarded, a lost {0} counted as a missing number. Every one of them compiled cleanly.